WhyHive
WhyHive is survey, sales, and customer feedback analysis software that enables users to upload and analyze a variety of data.
What is WhyHive?
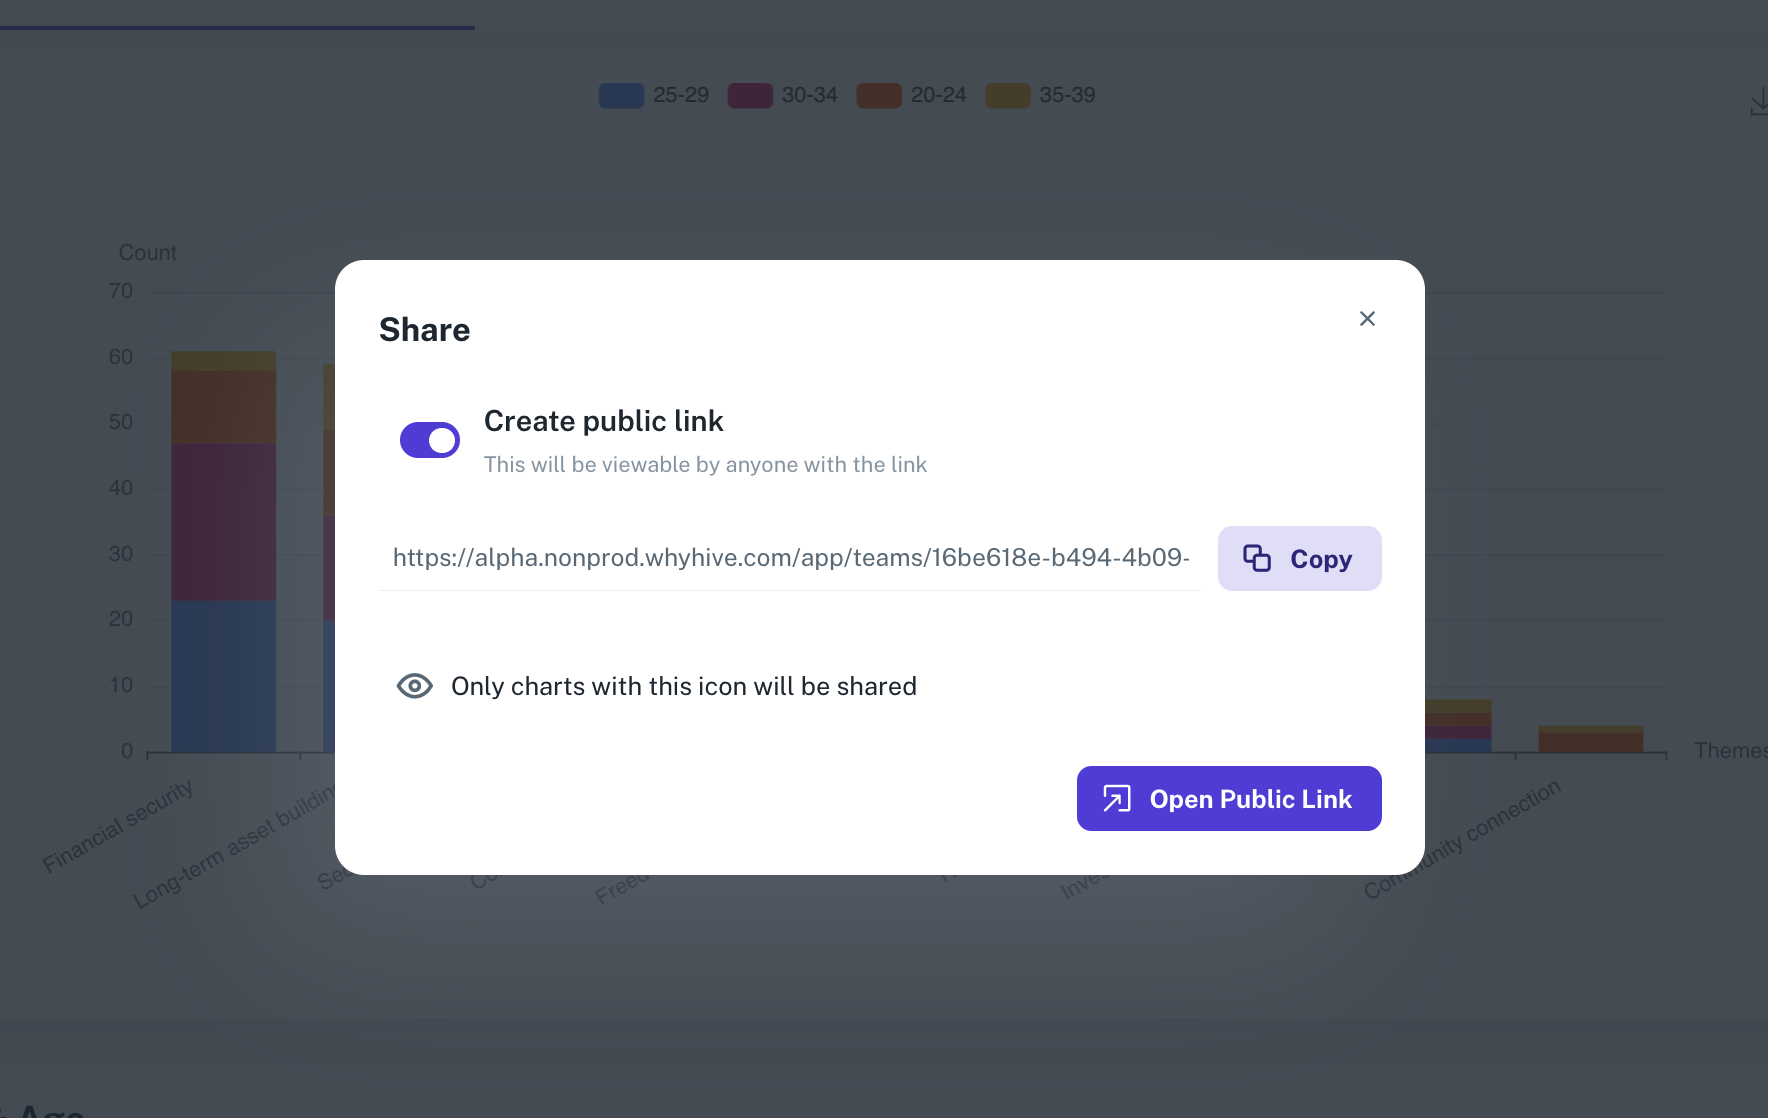
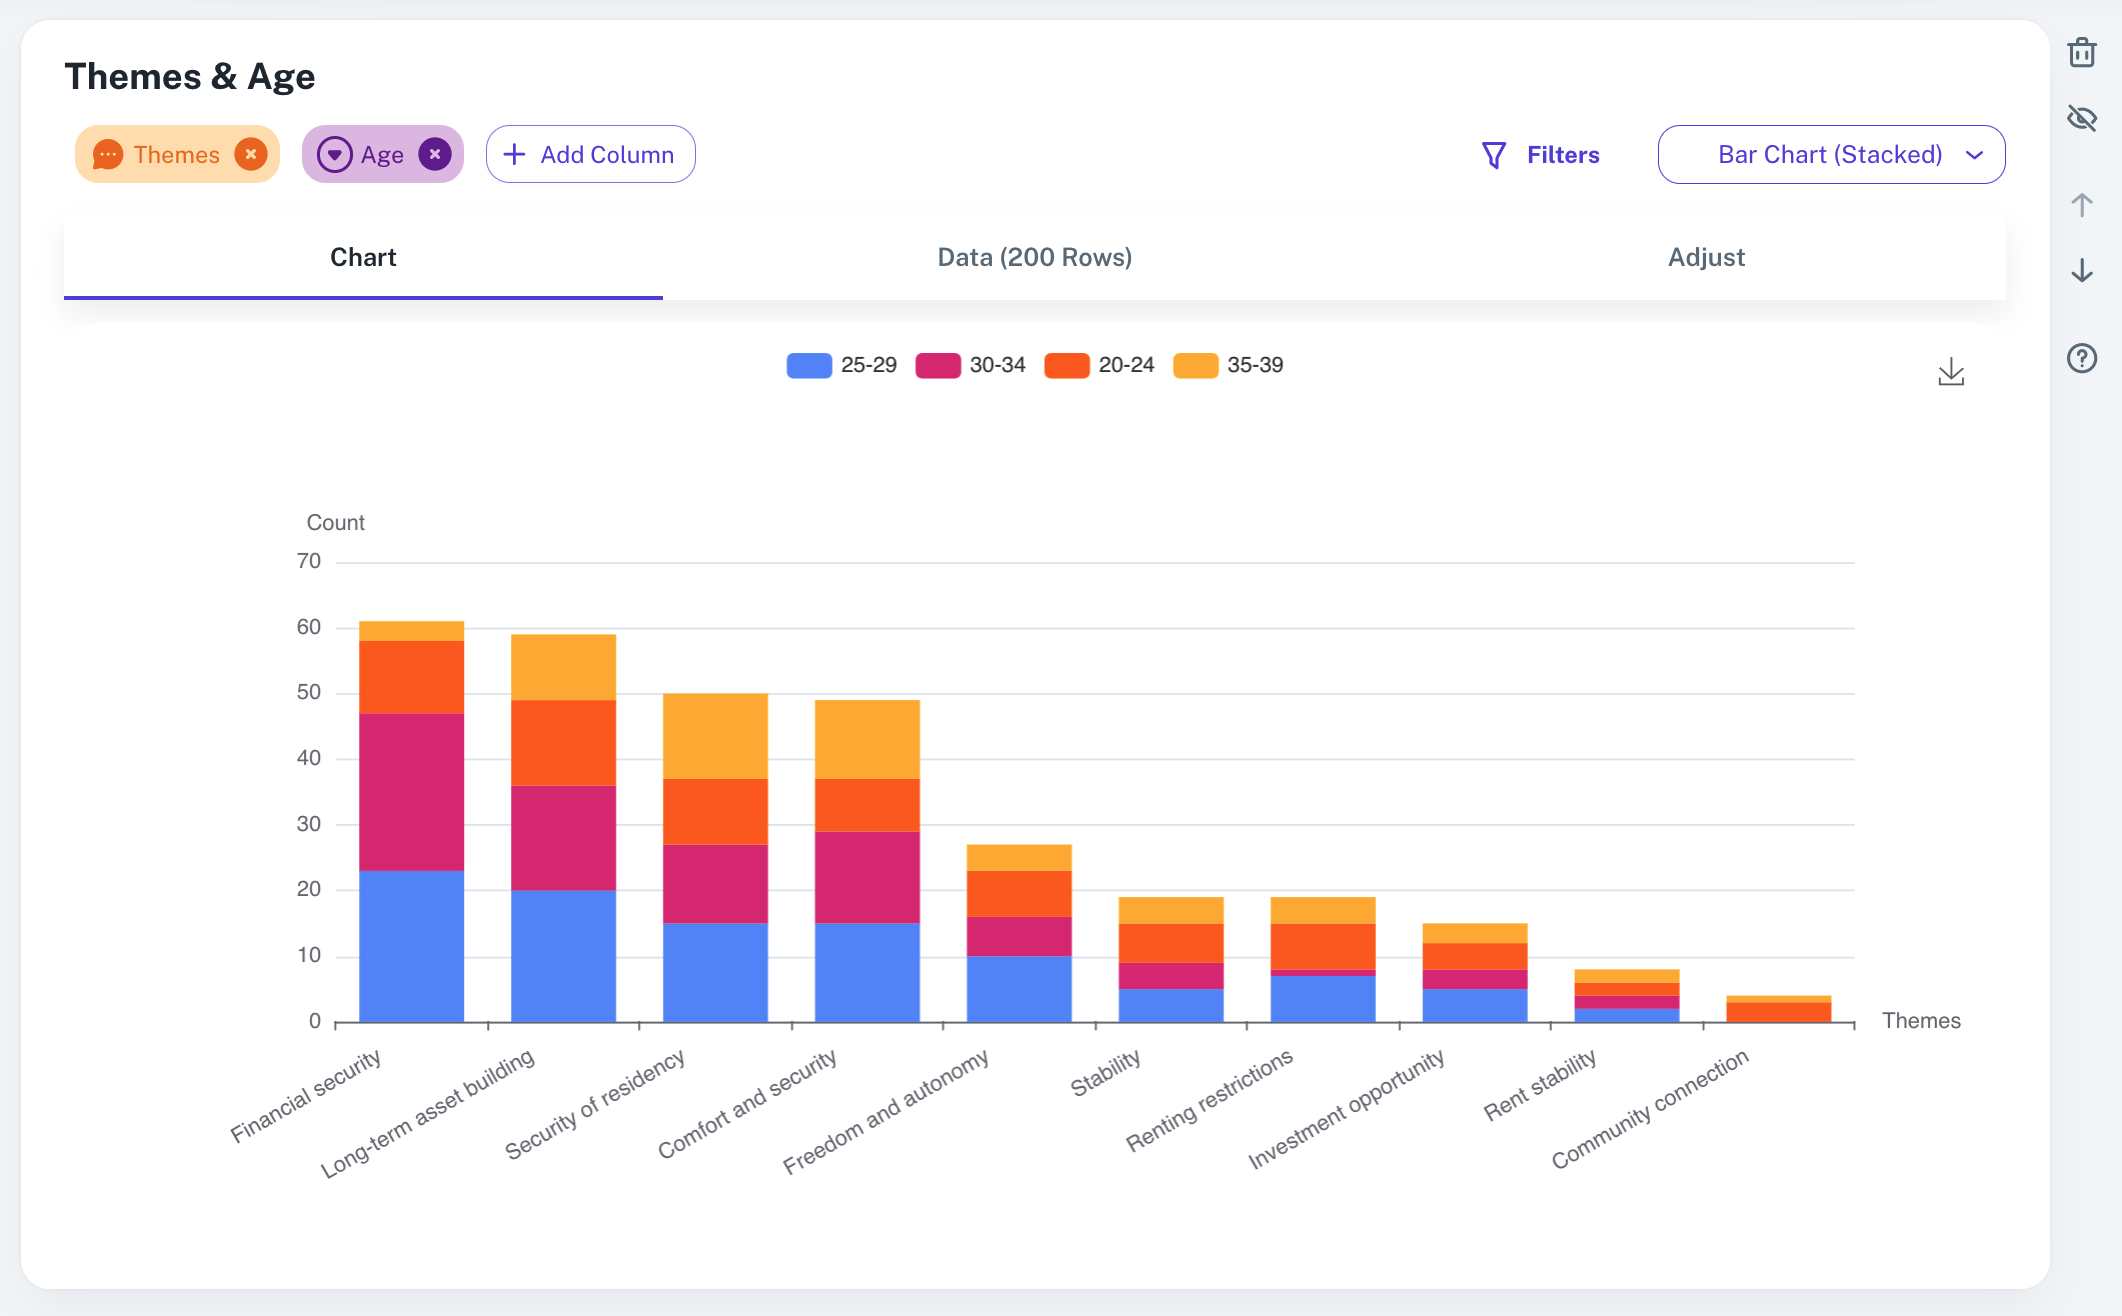
WhyHive is a data analysis software that allows users to easily visualize and analyze datasets like surveys, sales data, and customer feedback. Users can upload CSV or Excel files, and the software's intuitive interface allows for quick exploration and chart creation without coding or data science expertise required. WhyHive utilizes a combination of AI and rules-based algorithms to extract insights from both quantitative and qualitative data. Key features include text analysis to identify themes and assign codes, customizable charts and dashboards, and secure cloud-based data storage.
Screenshots
Video
Categories
Features
FAQ
WhyHive is a data analysis software that allows users to easily visualize and analyze datasets like surveys, sales data, and customer feedback. Users can upload CSV or Excel files, and the software's intuitive interface allows for quick exploration and chart creation without coding or data science expertise required. WhyHive utilizes a combination of AI and rules-based algorithms to extract insights from both quantitative and qualitative data. Key features include text analysis to identify themes and assign codes, customizable charts and dashboards, and secure cloud-based data storage.
WhyHive belongs to the Data Analysis category.
WhyHive offers features such as Data Discovery, Data Visualization, Reporting/Analytics, Self-service Analytics.
No, WhyHive does not offer a free trial.
Reviews(0)
Write a reviewWhyHive alternatives
Wix
Wix empowers small businesses to build and manage websites quickly. Most users rely on it for designing, blogging, and marketing. Its drag-and-drop editor and mobile access stand out for ease of use, while limitations in SEO and advanced customizatio...load more
Google Analytics 360
Google Analytics 360 is an enterprise-level analytics platform with in-depth performance indicators, such as ROI analysis reports. The app's primary function is to provide insights into customer behavior interactions with websites and apps to identif...load more
Procore
Procore construction management software handles construction projects, resources, people, and financials from planning to closeout.
Tableau
Tableau helps people transform data into actionable insights that make an impact. Easily connect to data stored anywhere, in any format. Quickly perform ad hoc analyses that reveal hidden opportunities. Drag and drop to create interactive dashboards ...load more
Google Cloud
Google Cloud Platform is cloud-based suite of solutions that allows users to create anything from websites to complex applications for businesses of all sizes across a range of industries. Google Cloud Platform offers a scalable data warehouse powere...load more
Microsoft Power BI
Power BI can help you connect your data into a single source of truth, uncover powerful insights from this data, and translate them into impact across your organization. Connect data across clouds, databases, and engines to OneLake to create a single...load more
IBM SPSS Statistics
IBM SPSS Statistics software is used by a variety of customers to solve industry-specific business issues to drive quality decision-making. Advanced statistical procedures and visualization can provide a robust, user friendly and an integrated platfo...load more
XLSTAT
The leading data analysis and statistical solution for Microsoft EXCEL. Analyze, customize and share your results.
Grow
Grow is a no-code, full-stack business intelligence (BI) platform that empowers everyone in your organization to make data-driven decisions. By combining ETL, data warehousing and visualization in one easy-to-use platform, any organization can connec...load more
Sisense
Sisense is the only business intelligence software that makes it easy for users to prepare, analyze and visualize complex data. Sisense provides an end-to-end solution for tackling growing data sets from multiple sources, that comes out-of-the-box wi...load more