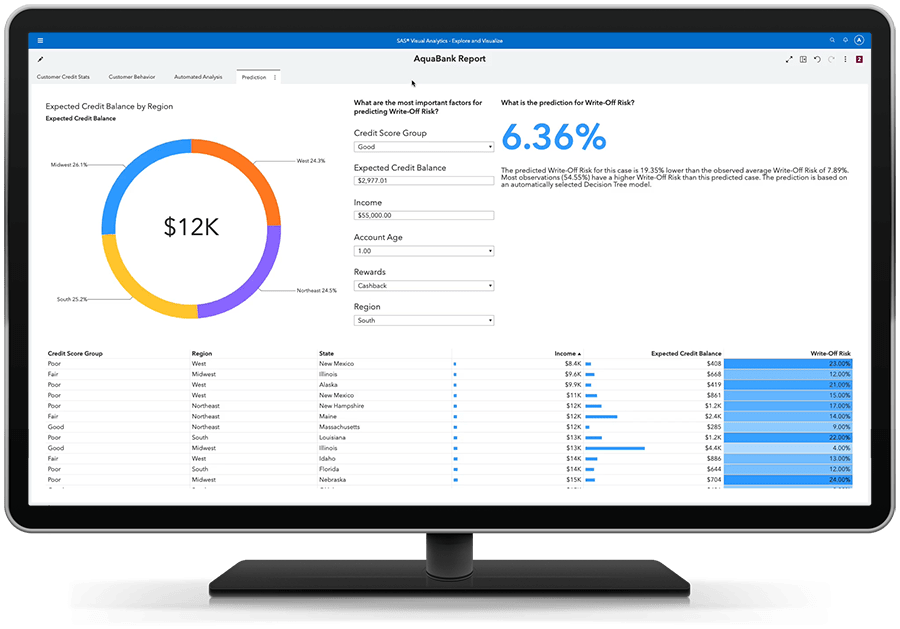
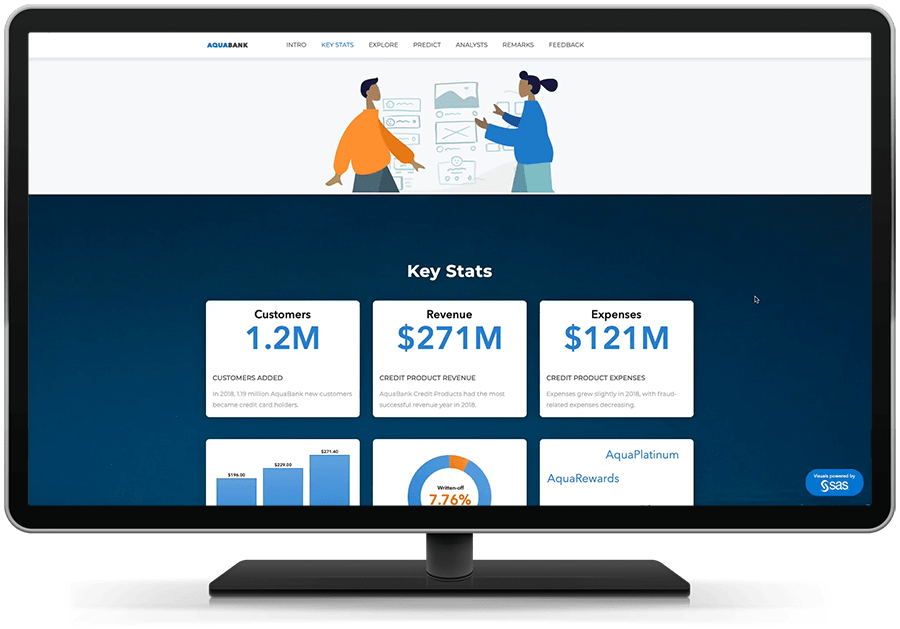
SAS Visual Analytics
Augmented analytics and chatbots in SAS Visual Analytics accelerate insights and help uncover stories hidden in your data.
What is SAS Visual Analytics?
Screenshots

Categories
Features
FAQ
The official website of SAS Visual Analytics is https://www.sas.com/en_us/software/visual-analytics.html
SAS Visual Analytics belongs to the Natural Language Processing (NLP), Big Data, Business Intelligence, Chatbot, Dashboard, Data Analysis, Data Collection, Data Discovery, Data Governance, Data Visualization, Integration, KPI, Location Intelligence, Predictive Analytics, Reporting, Statistical Analysis category.
SAS Visual Analytics offers features such as Machine Learning, Multi-Language, Search/Filter, Access Controls/Permissions, Data Connectors, Data Visualization, Forecasting, High Volume Processing, Statistical Analysis, Ad hoc Reporting, Collaboration Tools, Key Performance Indicators, Multiple Data Sources, Performance Metrics, AI/Machine Learning, Automated Responses, Chatbot, Customer Support, Customizable Branding, Natural Language Processing, Alerts/Notifications, Data Import/Export, KPI Monitoring, Reporting/Analytics, Data Discovery, Predictive Analytics, Self-service Analytics, Customizable Templates, Drag & Drop, Mobile Access, Third-Party Integrations, Dashboard Creation, Role-Based Permissions, Customizable Dashboard, Data Management, Reporting & Statistics, API, Customizable Reports, Real-Time Analytics, Demand Forecasting, Modeling & Simulation, Scheduled/Automated Reports, Regression Analysis, Statistical Simulation, Time Series Analysis.
Pricing
Starting at:
$8000/per year
Free Trial Available